

Enin's Company Browser is a favourite among our users, whether the goal is to find investment opportunities or to prioritise who to contact for sales. We have talked before about how useful Enin's Company Browser can be for finding good investment opportunities. Read on to see how you can use Enin to filter down based on a relatively realistic investment mandate. We go from 2 million organisation numbers to a focused selection of 50 possible investments.
In this three-part blog series on how to work with Enin in practice, we will show you how to get the most out of Enin's toolbox:
- Part 1: Where we roll up our sleeves and go looking for growing technology companies.
- Part 2: Where we dig deeper and integrate Enin's Datasets API into Excel.
- Part 3: Where we build infrastructure and integrate Enin's Datasets API via Alteryx.
Basic filters
If you are not particularly interested in newly established companies, but would rather focus on growth companies within technology, the search criteria could be something like this:
- Has more than five employees today
- Has some revenue, but no more than NOK 2 million in 2017
- Has an address in the Oslo area
- Is a "technology company"
- Is not part of a group
- Is relatively new
Let us try setting these filters in Enin's Company Browser. We start with 2207442 organisation numbers:

That is as many organisation numbers as we have ever found registered - anywhere at all. That said, depending on how you measure it, there are 200k to 300k active companies in Norway. What makes a company active can be defined in many ways. Having at least one employee, or having any revenue at all, are two ways of defining an active company.
We want companies that are growing. Let us start by making sure there are at least some employees in the companies we are interested in:
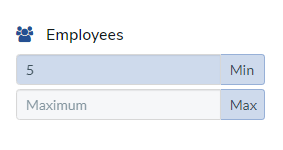
This takes the number of organisations down to 91200. Next, we can make sure the companies earned a little in 2017. If we had been analysing more mature companies, we might have used EBITDA (a measure of profit) in an analysis like this, but these are fairly young companies that may still be in the technology development phase in 2017. It therefore makes more sense to look at revenue as the metric. Let us say there should have been some revenue in 2017, but no more than NOK 2 million.

The number of organisations we are looking at then drops to 4163. Investment firms often have a local mandate, so you may well be more interested in one area than in others. Let us use the Oslo area as our area:
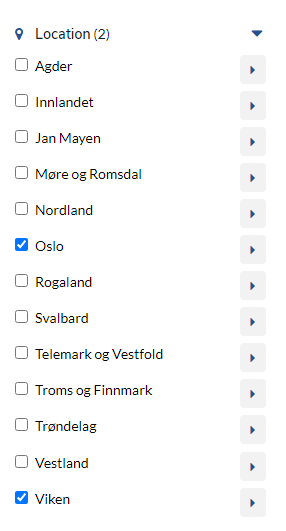
That leaves us with 1413 companies, but a fairly random mix of company types. Let us try to find technology companies.
Filtering on industry using NACE codes
To begin with, the following NACE codes can do the job on their own:
- 58.290 - Other software publishing
- 58.210 - Publishing of computer game software
- 63.990 - Other information services
- 63.110 - Data proc./storage and rel. services
- 63.120 - Operation of web portals
- 62.030 - Management and operation of IT systems
- 62.010 - Computer programming services
- 62.090 - Services rel. to information technology etc.
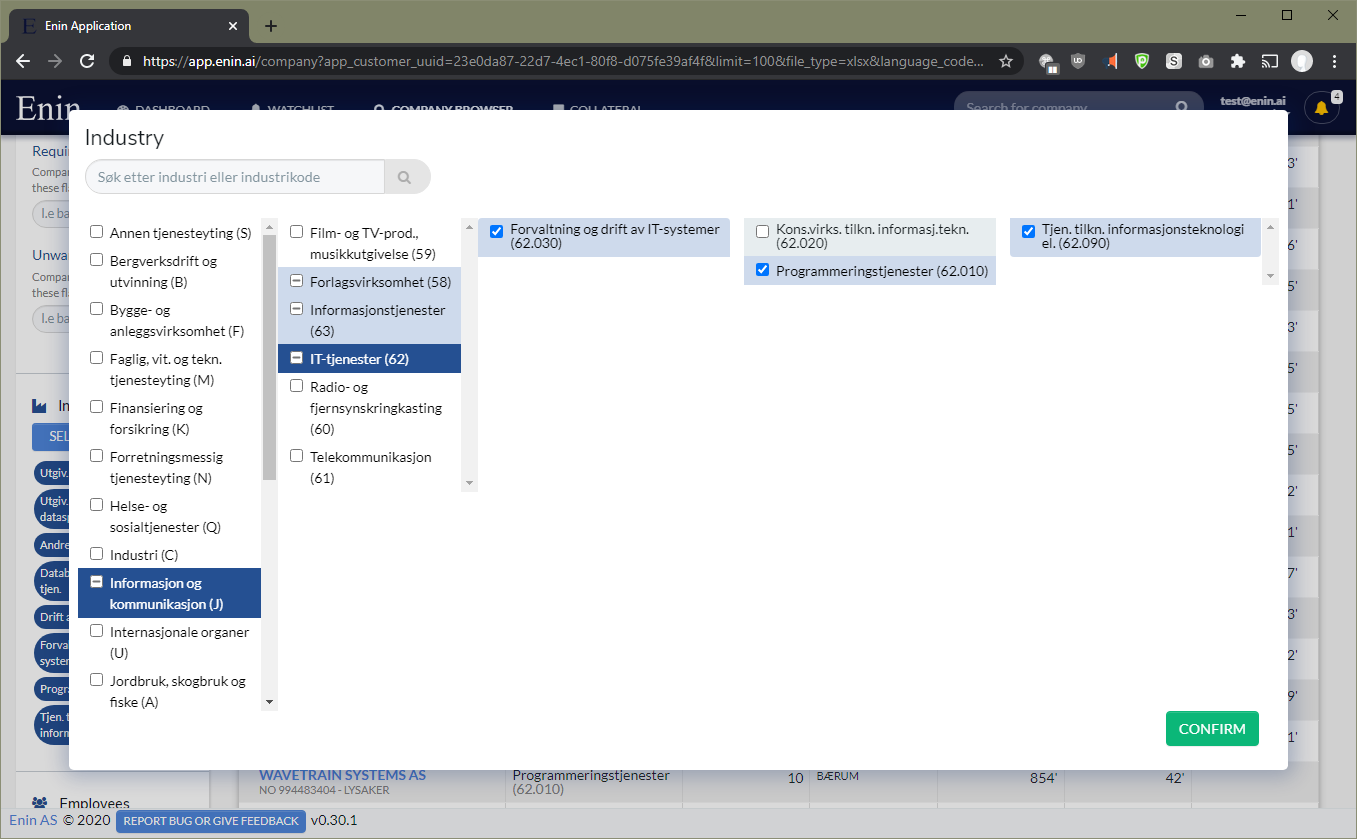
This takes us down to 86 companies. Here is the list sorted by employees:
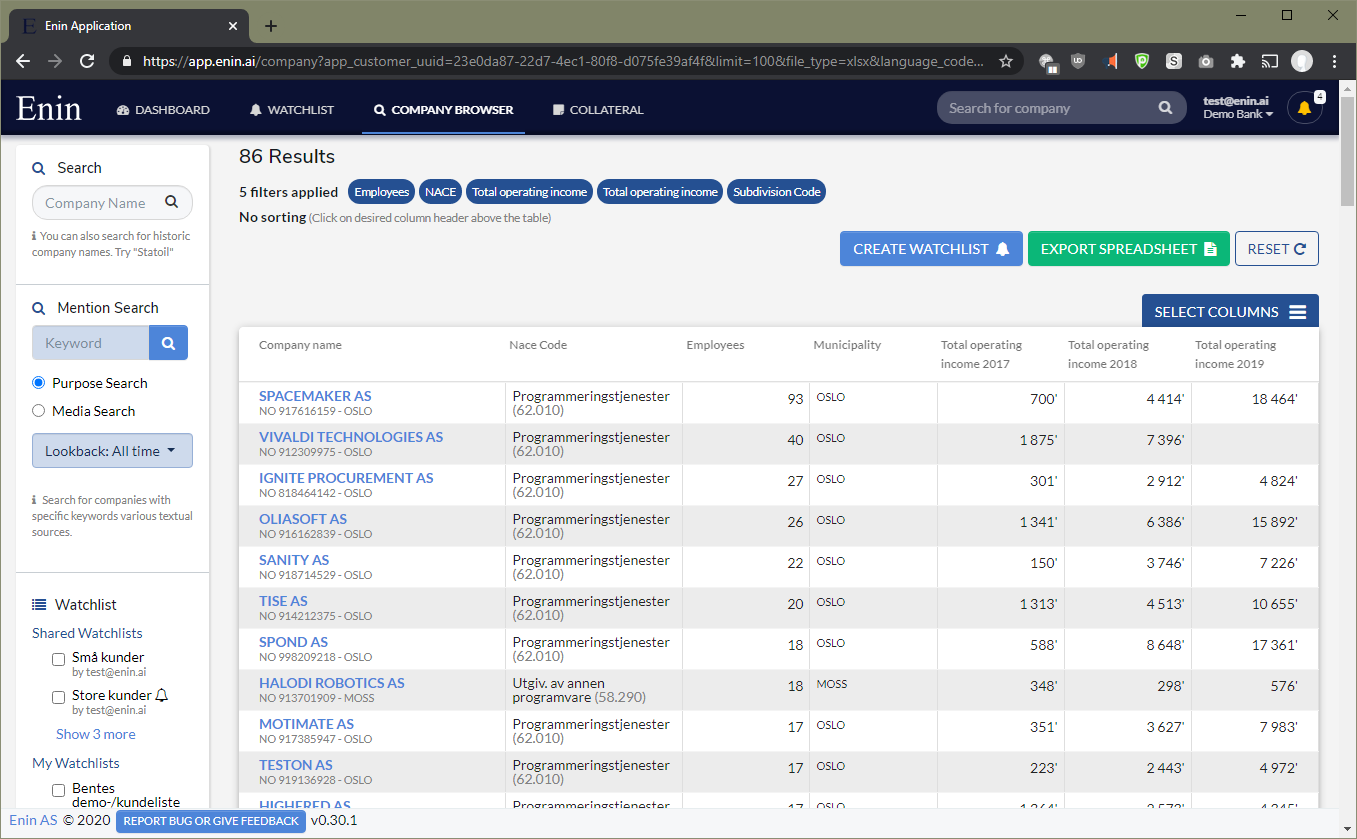
This is a perfectly good list if you want a more general one based on a single, clearly defined industry such as "software development", but what if you are more interested in a niche such as "software development for cars"?
Keyword-based industry search when NACE codes fall short
In cases like these you can use keyword-based industry search together with (or instead of) the filters you have set on NACE codes. These keyword searches are based on the purpose stated in the company's articles of association.
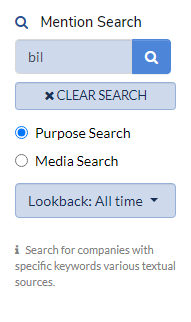
Let us keep the NACE codes we have set so far and add the keyword "bil" (car):
This gives us only two companies, since the filters we have set so far are already quite strict.
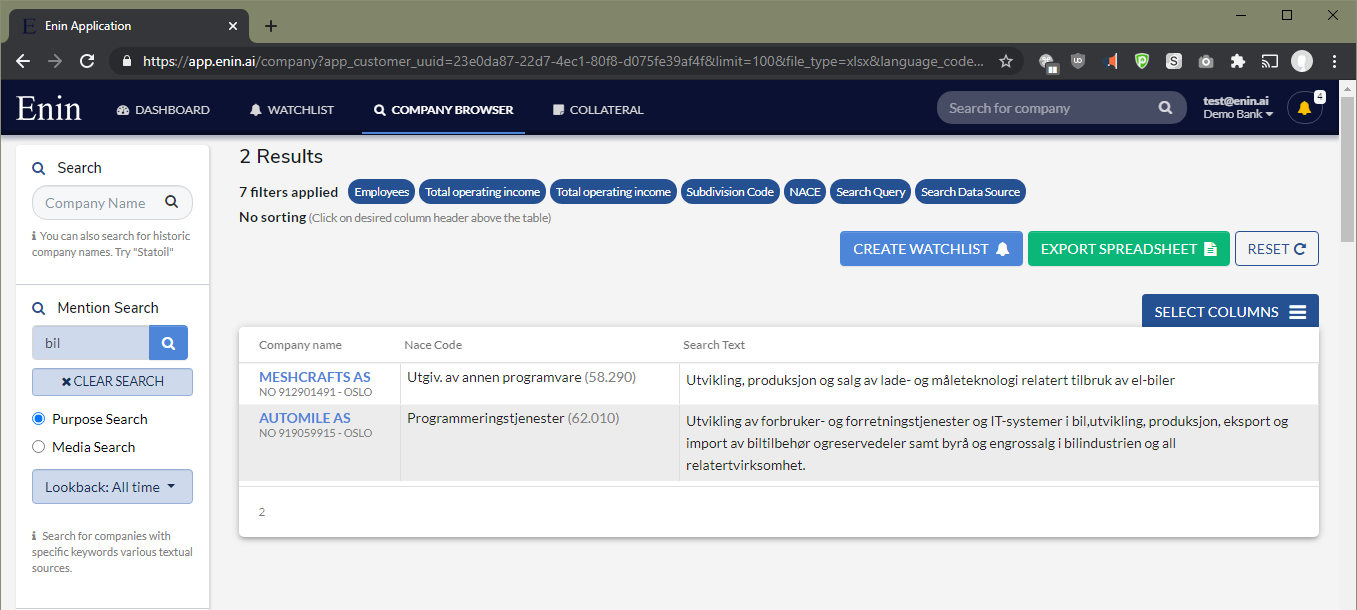
If this was what we were looking for, this might be the point where we could go back to the existing filters and make them less restrictive in order to get more hits.
Keyword-based industry codes make it possible to find niches of companies, and they are more up to date and more accurate than NACE codes.
That said, let us remove the "bil" filter and test how keywords can be used to ignore companies. Perhaps we, as investors, are not interested in companies that mention "konsulent" (consultant) in their purpose. In that case we can remove them by putting an exclamation mark (!) in front of the keyword and ending with a colon and an asterisk (:*), that is !konsulent:*, which in practice means:
"do not include companies whose purpose text starts with konsulent"
The colon and the asterisk (:*) are called a wildcard.
The trailing colon and asterisk (:*) is a wildcard and means that the keyword can end in any further letters, so "konsulent" and every other ending of the word are excluded.
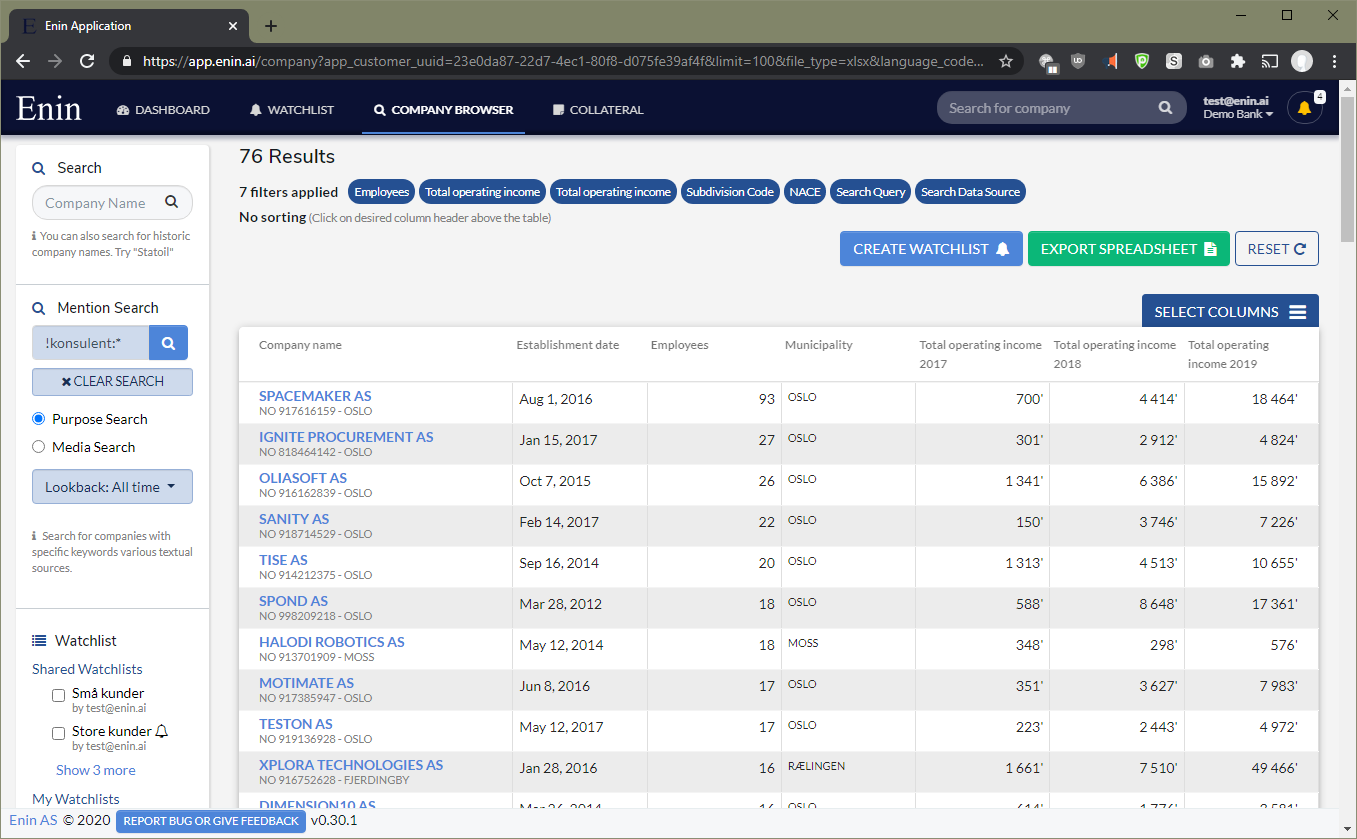
Now the selection is starting to take shape. In fact, the two companies at the top of the list above, Spacemaker and Ignite, are two of Enin's "sibling companies": companies that have taken part in the startup hub Arkwright X - where Enin belongs today.
Using company flags as a filter
Finally, we can use Enin's company flags to remove companies that belong to a group. They are hardly likely to let us invest in their companies anyway:
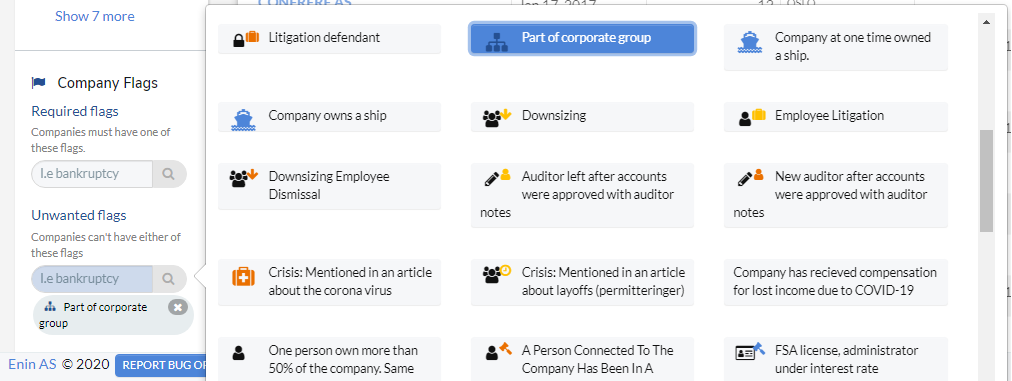
That leaves us with 58 companies.
Take it all the way: pull the data into Excel or inspect it in Enin's "Data Explorer"
Once we are happy with the list, we can export it to Excel and, for example, calculate CAGR:

... or we can set up a "watchlist" (company list) that can be used to monitor the companies for relevant events. The list can also be used for deep dives in the Data Explorer (beta functionality):

Here we have plotted our list so that the y-axis is revenue and the x-axis is cash per employee. If revenue is low, this can indicate how much "runway" the company has before it runs out of money.
That is it for now. In the next blog post we take it a step further and implement the search above directly in Excel using Enin's API.


