

In the previous blog post in this series we looked at how you can use Enin's "screening" tool, the Company Browser, to find good investment opportunities. In this post we take it to the next level and integrate similar data directly into Excel. Last time we finished with how to export data from the Company Browser to Excel. That is incredibly useful, but the method has a limitation: it is a bit fiddly to run the analysis again every time you want to update an existing Excel sheet. This can be partly solved by saving the query you have built as a bookmark in your browser. Even so, it would be better if we could integrate Enin's API directly into Excel, to take advantage of the almost unlimited possibilities there.
In this three-part blog series on how to work with Enin in practice, we will show you how to get the most out of Enin's toolbox:
- Part 1: Where we roll up our sleeves and go looking for growing technology companies.
- Part 2: Where we dig deeper and integrate Enin's Datasets API into Excel.
- Part 3: Where we build infrastructure and integrate Enin's Datasets API via Alteryx.
About Enin's "Datasets API"
The Datasets API focuses on delivering large volumes of data for data analysis and data warehouse operations. It works over "HTTPS" calls, which are currently recognised as the standard for most web API integrations. That said, the underlying infrastructure is built to be considerably more flexible than most APIs, and is heavily optimised for data extraction.
The Datasets API consists of several "endpoints" divided into logical groupings. As of January 2021, the following groupings of Datasets API "endpoints" exist:
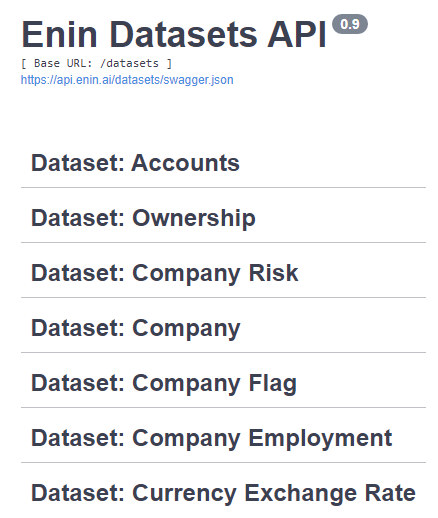
Each "endpoint" has a web address pattern, that is a URL, which can be modified to retrieve different data. In principle these are queries. Here is a simple example:
https://api.enin.ai/datasets/v1/dataset/company?limit=10This retrieves 10 random companies as a JSON file. If you add &order_by_fields=company.name and &response_file_type=csv at the end, you can sort them by name and get the data as a CSV file instead:
https://api.enin.ai/datasets/v1/dataset/company?
limit=10&order_by_fields=company.name&response_file_type=csv
(remember to remove "whitespace" and "newlines" if you copy and paste the above)
You can do a great deal more as well, but for now let us not get bogged down in tedious details and syntax, and focus instead on the problems this can solve. For technical details we recommend this Datasets API guide.
Connecting the Datasets API to Excel
In this guide we are using "Microsoft Excel Version 2012" from "Microsoft 360 MSO".
Excel is an often underestimated platform. There are plenty of integration options that give practically unlimited scope for analysis. It is a matter of knowing where to look.
Let us get started with the integration.
Go to the "Data" tab in Excel, then click "From Web". Alternatively, navigate through "Get Data" > "From Other Sources" > "From Web":

This brings up the "From Web" window, where you can enter the URL "endpoints" we talked about earlier. In the URL box we can enter the URL we just went through.

This takes us to an authentication window. If you have not received access details for the Datasets API, request access here. Enter the "Basic Authentication Client ID" and "Basic Authentication Client Secret" from the access details you have been given, and select https://api.enin.ai/ as the access level. This makes the access details valid for the other "endpoints" we use.

When you now select "connect", you will get a preview of the data:
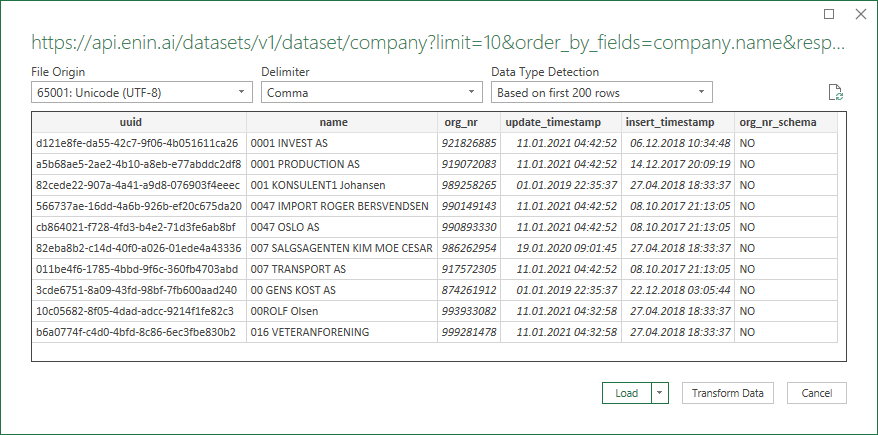
If you click "Load", you will get a new sheet with a data table tied to what Excel calls a "Query".

If you have made it this far, you now have Enin data ready for whatever you need to do in Excel.
One thing worth mentioning is how to change or remove the access details from Excel. Go to the "Data" tab, then "Get Data" > "Data Source Settings...":
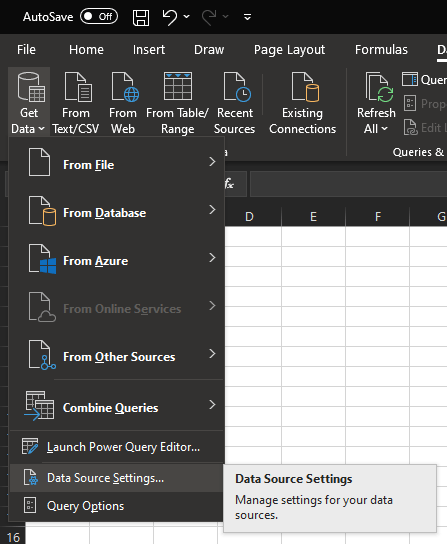
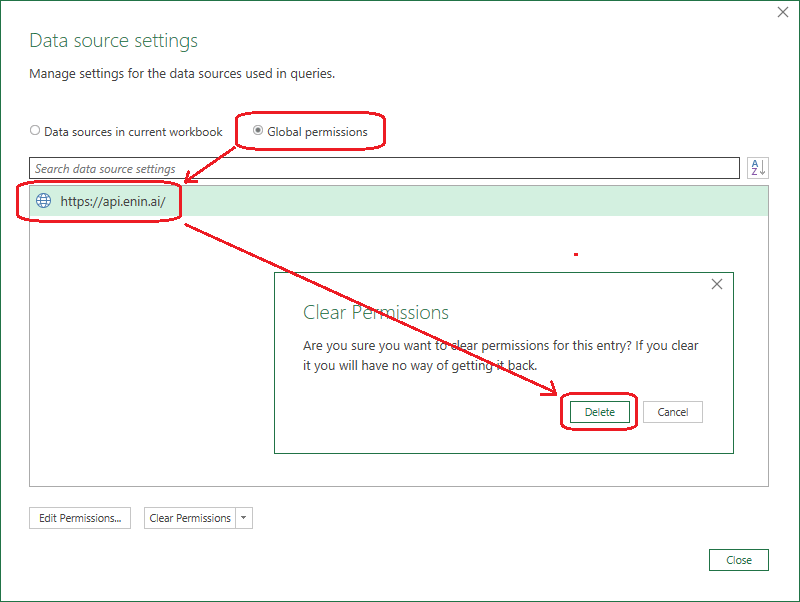
... and then select "Global permissions". From here you can make changes and/or remove the access details entirely:
Synchronising your company lists/watchlists
Now we know how to integrate an API "endpoint". Let us pull in some figures to work with. If you remember from the previous post, we built a relevant list of companies using the "Company Browser" in the web portal. We then exported it to Excel and could carry on working with it from there. That is very useful, but how do we keep it up to date?
Exporting "Company Browser" data to Excel is useful, but it often gets fiddly if you want to do the same operation frequently. Synchronising company lists/"watchlists" can make this easier.
The list we built last time can be saved as a company list/"watchlist" instead of being exported:

If you look closely at the address bar at the top of your browser, you will see that the "watchlist" has an "id" we can use, af2f21ab-19c0-4a01-be70-0465d11056f8, as part of the API "endpoint" URL we are building. Let us fetch some financial data using the following URL:
http://api.enin.ai/datasets/v1/dataset/accounts-composite?response_file_type=csv
&watchlist_uuid=af2f21ab-19c0-4a01-be70-0465d11056f8
&accounts.accounting_year=2019
&keep_only_fields=
    company.org_nr,
    company.name,
    accounts_highlights.income_statement__operating_revenue,
    accounts_highlights.income_statement__ebitda,
    accounts_highlights.balance__cash_and_deposits
(remember to remove "whitespace" and "newlines" if you copy and paste the above)
Here we have set which "watchlist" we are fetching data for with watchlist_uuid=af2f21ab-19c0-4a01-be70-0465d11056f8 and that we want financial figures for 2019 only with accounts.accounting_year=2019 and that we want revenue, EBITDA and cash/bank deposits as data fields by using the parameter keep_only_fields. An example of such a field isaccounts_highlights.income_statement__operating_revenue where accounts_highlights is the entity/table in the Enin system and income_statement__operating_revenue is the data field.
If you do not know exactly which field you want to keep, you can always remove the parameter keep_only_fields. You then get every data field, which you can use as a starting point for your next query.
Now let us put the URL we have built to use. Go to the "Data" tab, click "From Web" and enter the URL in the "From Web" window:

This time we unfortunately have to do a little more work to get the data out correctly, so click "Transform Data" in the preview window:

This opens the "Power Query Editor" tool, which gives us fine-grained control over how the data is retrieved and transformed before it ends up in the Excel sheet. The reason we have to make changes here is that the API uses standard number formatting with a full stop (.) as the decimal separator, rather than the comma (,) that is peculiar to Norway. My Excel is apparently configured to use Norwegian "culture" by default even though it is set to English, and yours probably is too, so we have to override how Excel interprets the columns we are importing.
But yes, we do this by selecting "Changed Type" in the panel on the right. First we update the formula at the top so that the accounting columns are set to type number. And then we have to force the full stop (.) to be used by adding "en-US" as the last "culture" parameter. Once this is done we can select "Close & Load" in the top left. You will find a summary below:

This adds a new sheet with data. Now we can do things like plot data and set filters and sorting in Excel, and so on.
If we sort on cash_and_deposites we can see that quite a few companies hold a good deal of "cash". Let us say we are not that interested in these companies and want to remove them from the company list/"watchlist":
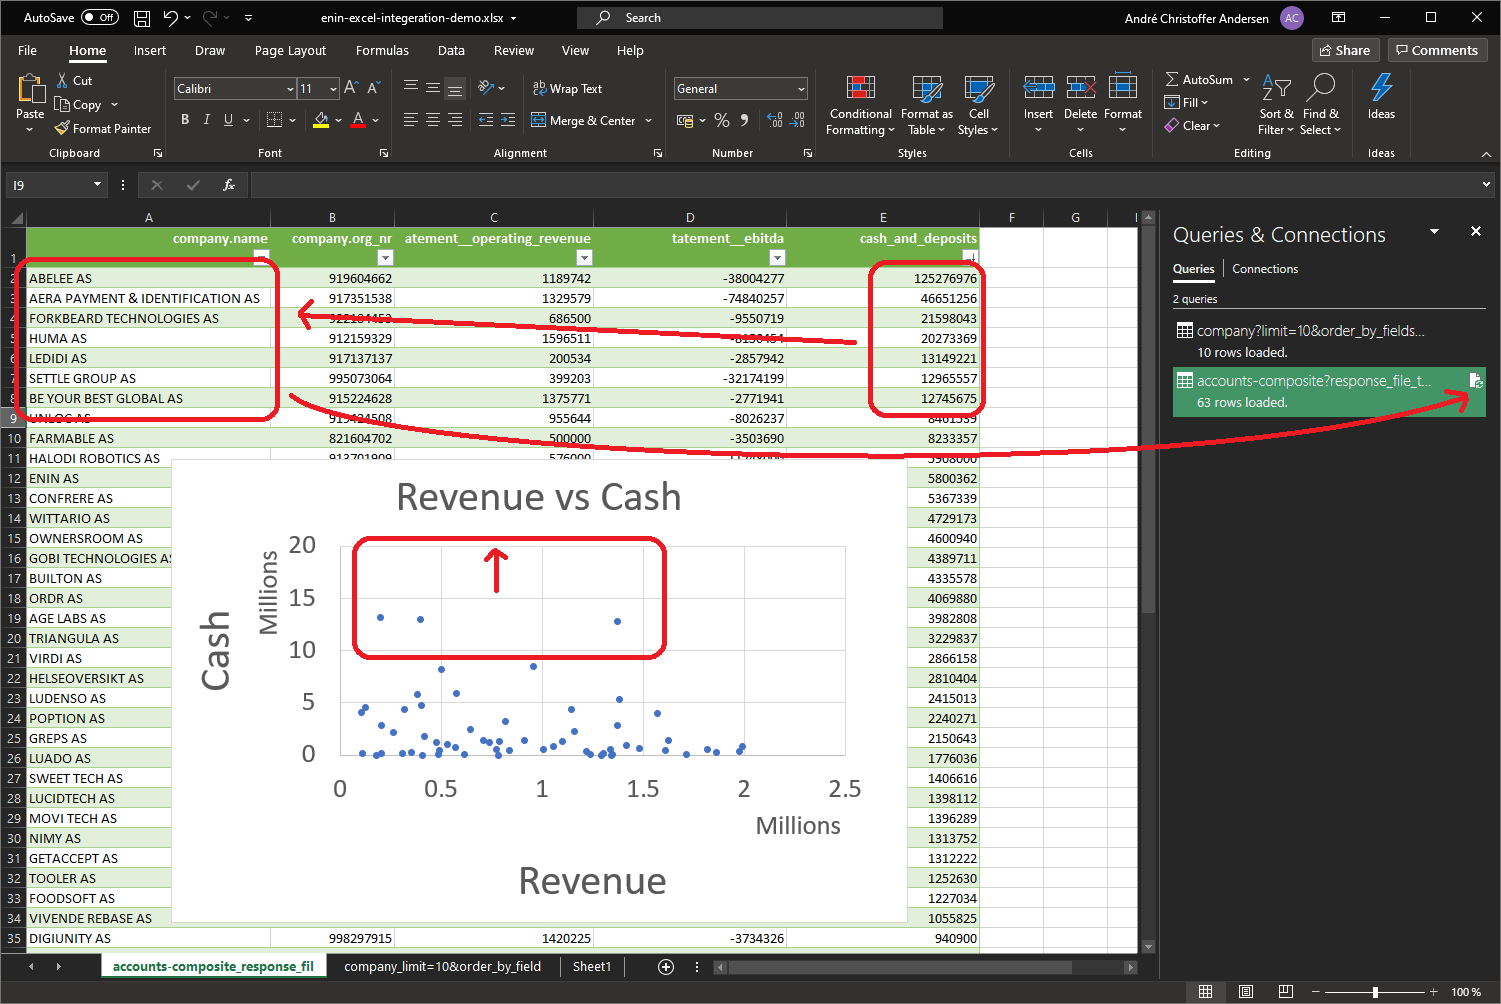
Let us go to the web portal and look them up so we can remove them from the "watchlist":

If we had used the Excel export from the Company Browser instead, we would not have been able to synchronise the data. But now we can refresh the Excel sheet with fresh data like this:

As you can see, the companies with more than NOK 10 million in "cash" are gone. In other words, we managed to synchronise the Excel sheet.
API filtering
One thing to note is that you do not have to filter on company lists/"watchlists" alone. That is just one of many possible ways to filter.
You are free to filter on any data field in the system
The filter types available are as follows:

In the previous example we removed companies directly from a company list/"watchlist". We could also have filtered them out by changing the URL we used against the API, without changing the underlying company list.
Let us continue with the previous example and try to remove companies with revenue below NOK 0.5 million. To do this we can add &accounts_highlights.income_statement__operating_revenue=GTE:500000 to the URL. Here GTE stands for "Greater Than or Equals", meaning we keep only companies with more than NOK 0.5 million in revenue.
http://api.enin.ai/datasets/v1/dataset/accounts-composite?response_file_type=csv
&watchlist_uuid=af2f21ab-19c0-4a01-be70-0465d11056f8
&accounts.accounting_year=2019
&keep_only_fields=
    company.org_nr,
    company.name,
    accounts_highlights.income_statement__operating_revenue,
    accounts_highlights.income_statement__ebitda,
    accounts_highlights.balance__cash_and_deposits
&accounts_highlights.income_statement__operating_revenue=GTE:500000
(remember to remove "whitespace" and "newlines" if you copy and paste the above)
If we refresh the query in Excel, you will see that the companies with less than NOK 0.5 million in revenue are gone:

They still exist in the underlying company list, so the changes only happen in your Excel sheet.
Pro tip: you can use the keyboard shortcut "Ctrl+Alt+F5" to refresh all your queries in Excel.
And there you have it: Excel integration with Enin's Datasets API. In the next "working with Enin in practice" post we look at how to do a similar integration with Alteryx. With a tool like that you really will have unlimited scope for integration and analysis.


